Reading an ISKRA AM550 P1 Port with a Pi
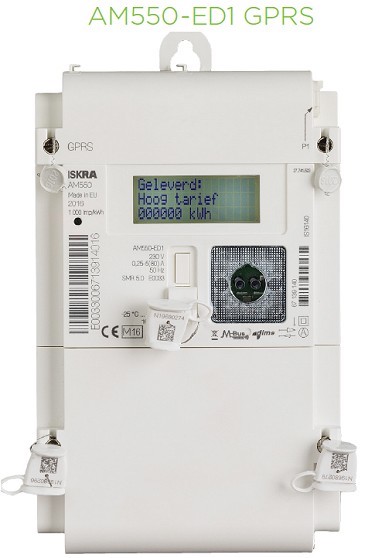
I've got an AM550 Smart meter with a P1 port. Seeing all the online content and suggestions about reading your smart meter, I decided to have an hour of fun trying to read the P1 data. Here's how I did it:
The P1 port on the AM550 sends serial data, but the signal is inverted. It is possible to invert that in software, but it is a kludge that requires some bit banging. Bringing the data in the right polarity and connecting it to the Rx serial input on the GPIO port is the cheapest and fastest way to go if you happen to have an RJ11 connenctor, a PNP transistor and a few resistors lying around. Here are my notes on how I wired the P1 to the Raspberry:
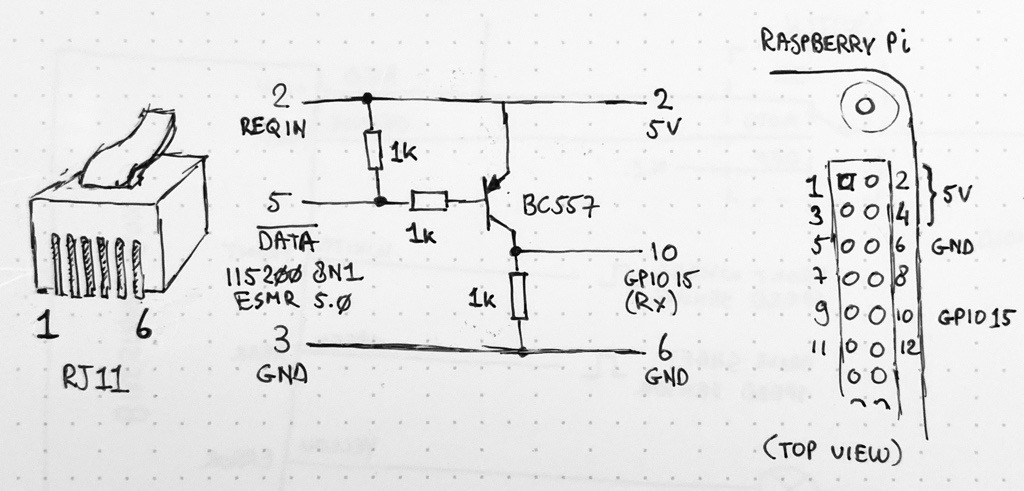
All that was left is reading the data from the serial port. Pin 10 maps to GPIO15 and happens to also be the Rx pin on the Raspberry Pi's internal Serial adapter, which is available as a device at /dev/ttyAMA0 (I did not choose this pin by accident ;-). I wrote a simple Python script to read the serial port so I could change it to produce munin graphs later:
 1import serial
 2ser = serial.Serial(
 3   port='/dev/ttyAMA0',
 4   baudrate = 115200,
 5   parity=serial.PARITY_NONE,
 6   stopbits=serial.STOPBITS_ONE,
 7   bytesize=serial.EIGHTBITS,
 8   timeout=1
 9)
10while True:
11   print ser.readline()
When running this program, you should see a whole blob of text scroll by about every second or so. It is readable ASCII and can be parsed by many libraries out there. I tried a few but they were sometimes buggy, or sometimes overengineered and requiring a lot of external resources. So I wrote my own, very crude, parsing. It is not like the meter will be updated every week with new software and ssl certificates.
There are actually only a few lines in the output that interest me:
- Lines starting with 1-0:1.7 contain the current power usage in Watts
- Lines starting with 1-0:1.8.1 are the T1 (low tariff) meter reading in Watt-hours.
- Lines starting with 1-0:1.8.2 are the T2 (high tariff) meter reading in Watt-hours.
A few lines of additional python gave me three separate munin plugins to produce the graphs I wanted. Here is a nice one showing the power usage of last week, split between high and low tariff.
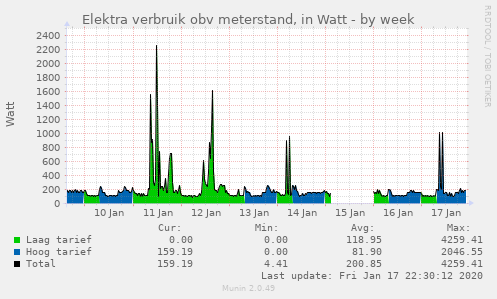
This nice graph also shows one of the problems with smart meters: Given enough resolution, you can see at which times devices and lights are switched on. This can provide some interesting patterns, and enables anybody with access to your meter data to determine when you are home or on vacation. Of course there are some tricks to create constant or confusing usage patterns, I'm sure you'll come up with something smart now that you can see the graphs.
You can find all three munin plugins in my munin-plugin repository, in the "plugin" folder. There may also be other interesting stuff there for you munin enthausiasts.
Have fun!